When I was a boy, my dad and grandmother would occasionally play sheepshead at my great-uncle’s house. I was at an age where I would sit behind my dad or grandma and watch the hands play out, but I wasn’t allowed to play. One Saturday night, my great-uncle pulled out an electric card shuffler he bought at a yard sale that morning. Between hands he would feed the cards through the shuffler, and the dealer would take the cards out and deal them.
The new shuffler made it about 30-60 minutes into the night before the complaints became too loud and angry. He put the shuffler away, and the group went back to the usual manual shuffle. I couldn’t help noticing the people complaining the loudest about the shuffler were the same people who complained about the cards every other night.
Some Probability Inuition
In a first semester statistics course, professors often assign student to flip a coin 100 times and record whether the result was a heads or tails. When the students return with the results, the professor records the total number of heads from each individual. The professor also asks for the longest streak (ie. the longest string of either heads or tails). Plotting all of the first values reveals the distribution is normal, and the answer to the second question reveals whether it is likely the student actually flipped the coin. You won’t believe this but some students simply right down H (heads) or T (tails) in a pattern they believe is realistic rather than flipping the coin.

At the bottom of this article, the Python code is included that runs the simulation mentioned here. You can run this for yourself and play around with the results.
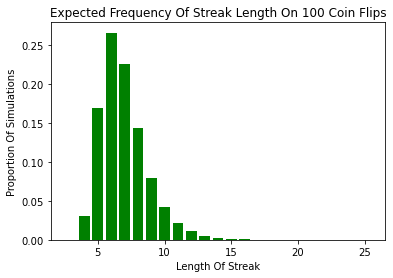
The most common longest streak is 6, followed by 7. This might surprise you. When a student decides to simply write down H or T instead of flipping the coin, it is common for them to keep their longest streak to 4 since a streak longer than that seems improbable to them. A longest streak of 4 or fewer only happens in about 3% of sets of 100. Further, a longest streak of 11 or more happens in more than 4% of sets of 100.
A 4% probability is rare. If your college roommate said they flipped a coin 100 times and had 11 heads in a row at one point, that would sound pretty unusual. Consider a classful of 25 students who each flip a coin 100 times. Would you be surprised if 1 of the 25 flipped 11 of either side in a row? You shouldn’t.
Probability of 11 of either side in a row:
4.2%
Probability of at least 1 in 25 students flipping 11 in a row:
1 - (1-.042)25 = 65.8%
More students flipping a coin 100 times means a higher probability that one of them will flip 11 in a row. An entire lecture hall of 200 students flipping a coin 100 times would produce at least one student with 11 in a row 99.98% of the time. It would be strange indeed if no one did it.
Summarizing the number of heads observed by each student
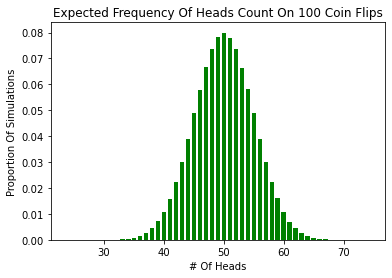
When someone flips a coin 100 times, we expect they will flip 50 heads on average (100 · 0.5). We expect the probability that 45 heads are flipped will be the same as the probability of 55 heads. This has to do with the symmetry in the distribution of heads count.

When looking at a distribution like this, one thing we are very interested in is the standard deviation of the thing we are trying to observe. In this situation, the standard deviation is the average distance between the total number of heads a student flips and the expected number of heads (50). The smaller the standard deviation, the steeper the bars will rise to the peak and fall after.
In our case, the standard deviation is about 5. Because of what we know about normal (Guassian) distributions, we know that about 95% of the observations will come in between 40 and 60. Going back to the lecture hall of 200 students, we would expect 10 students to flip a number of heads outside of 40-60. It is important to recognize that just as it would be strange if 50 of the 200 students returned a result outside of 40 and 60, it would also be strange if the number of students was extremely small.
In subsequent articles, we will review data from dealt hands for oddities. Much of what was discussed above will come in handy as we look at that data.
1 | import random |